Stewarding the Ottawa River watershed takes passion — and data
Monitoring water quality in an area twice the size of New Brunswick is no small task. But size is just the first challenge for Ottawa Riverkeeper — a charitable organization that works to protect and improve the ecological health of the Ottawa River watershed.
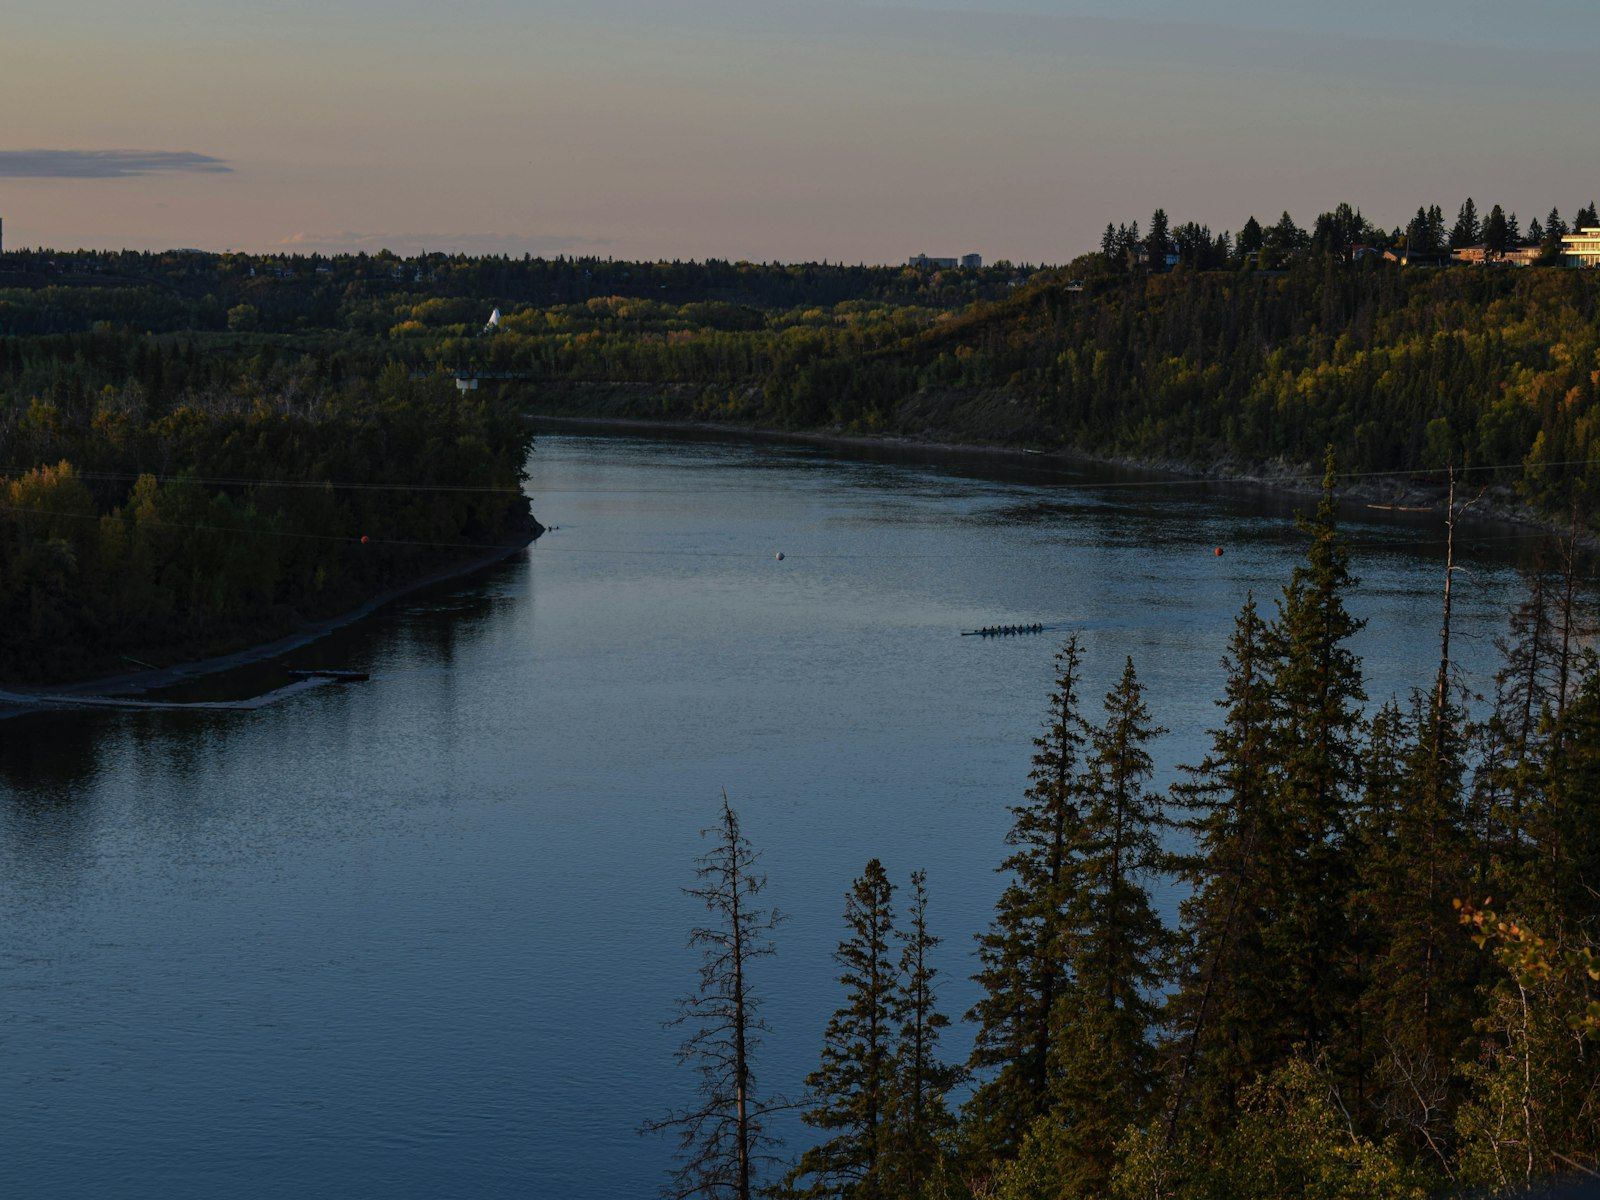
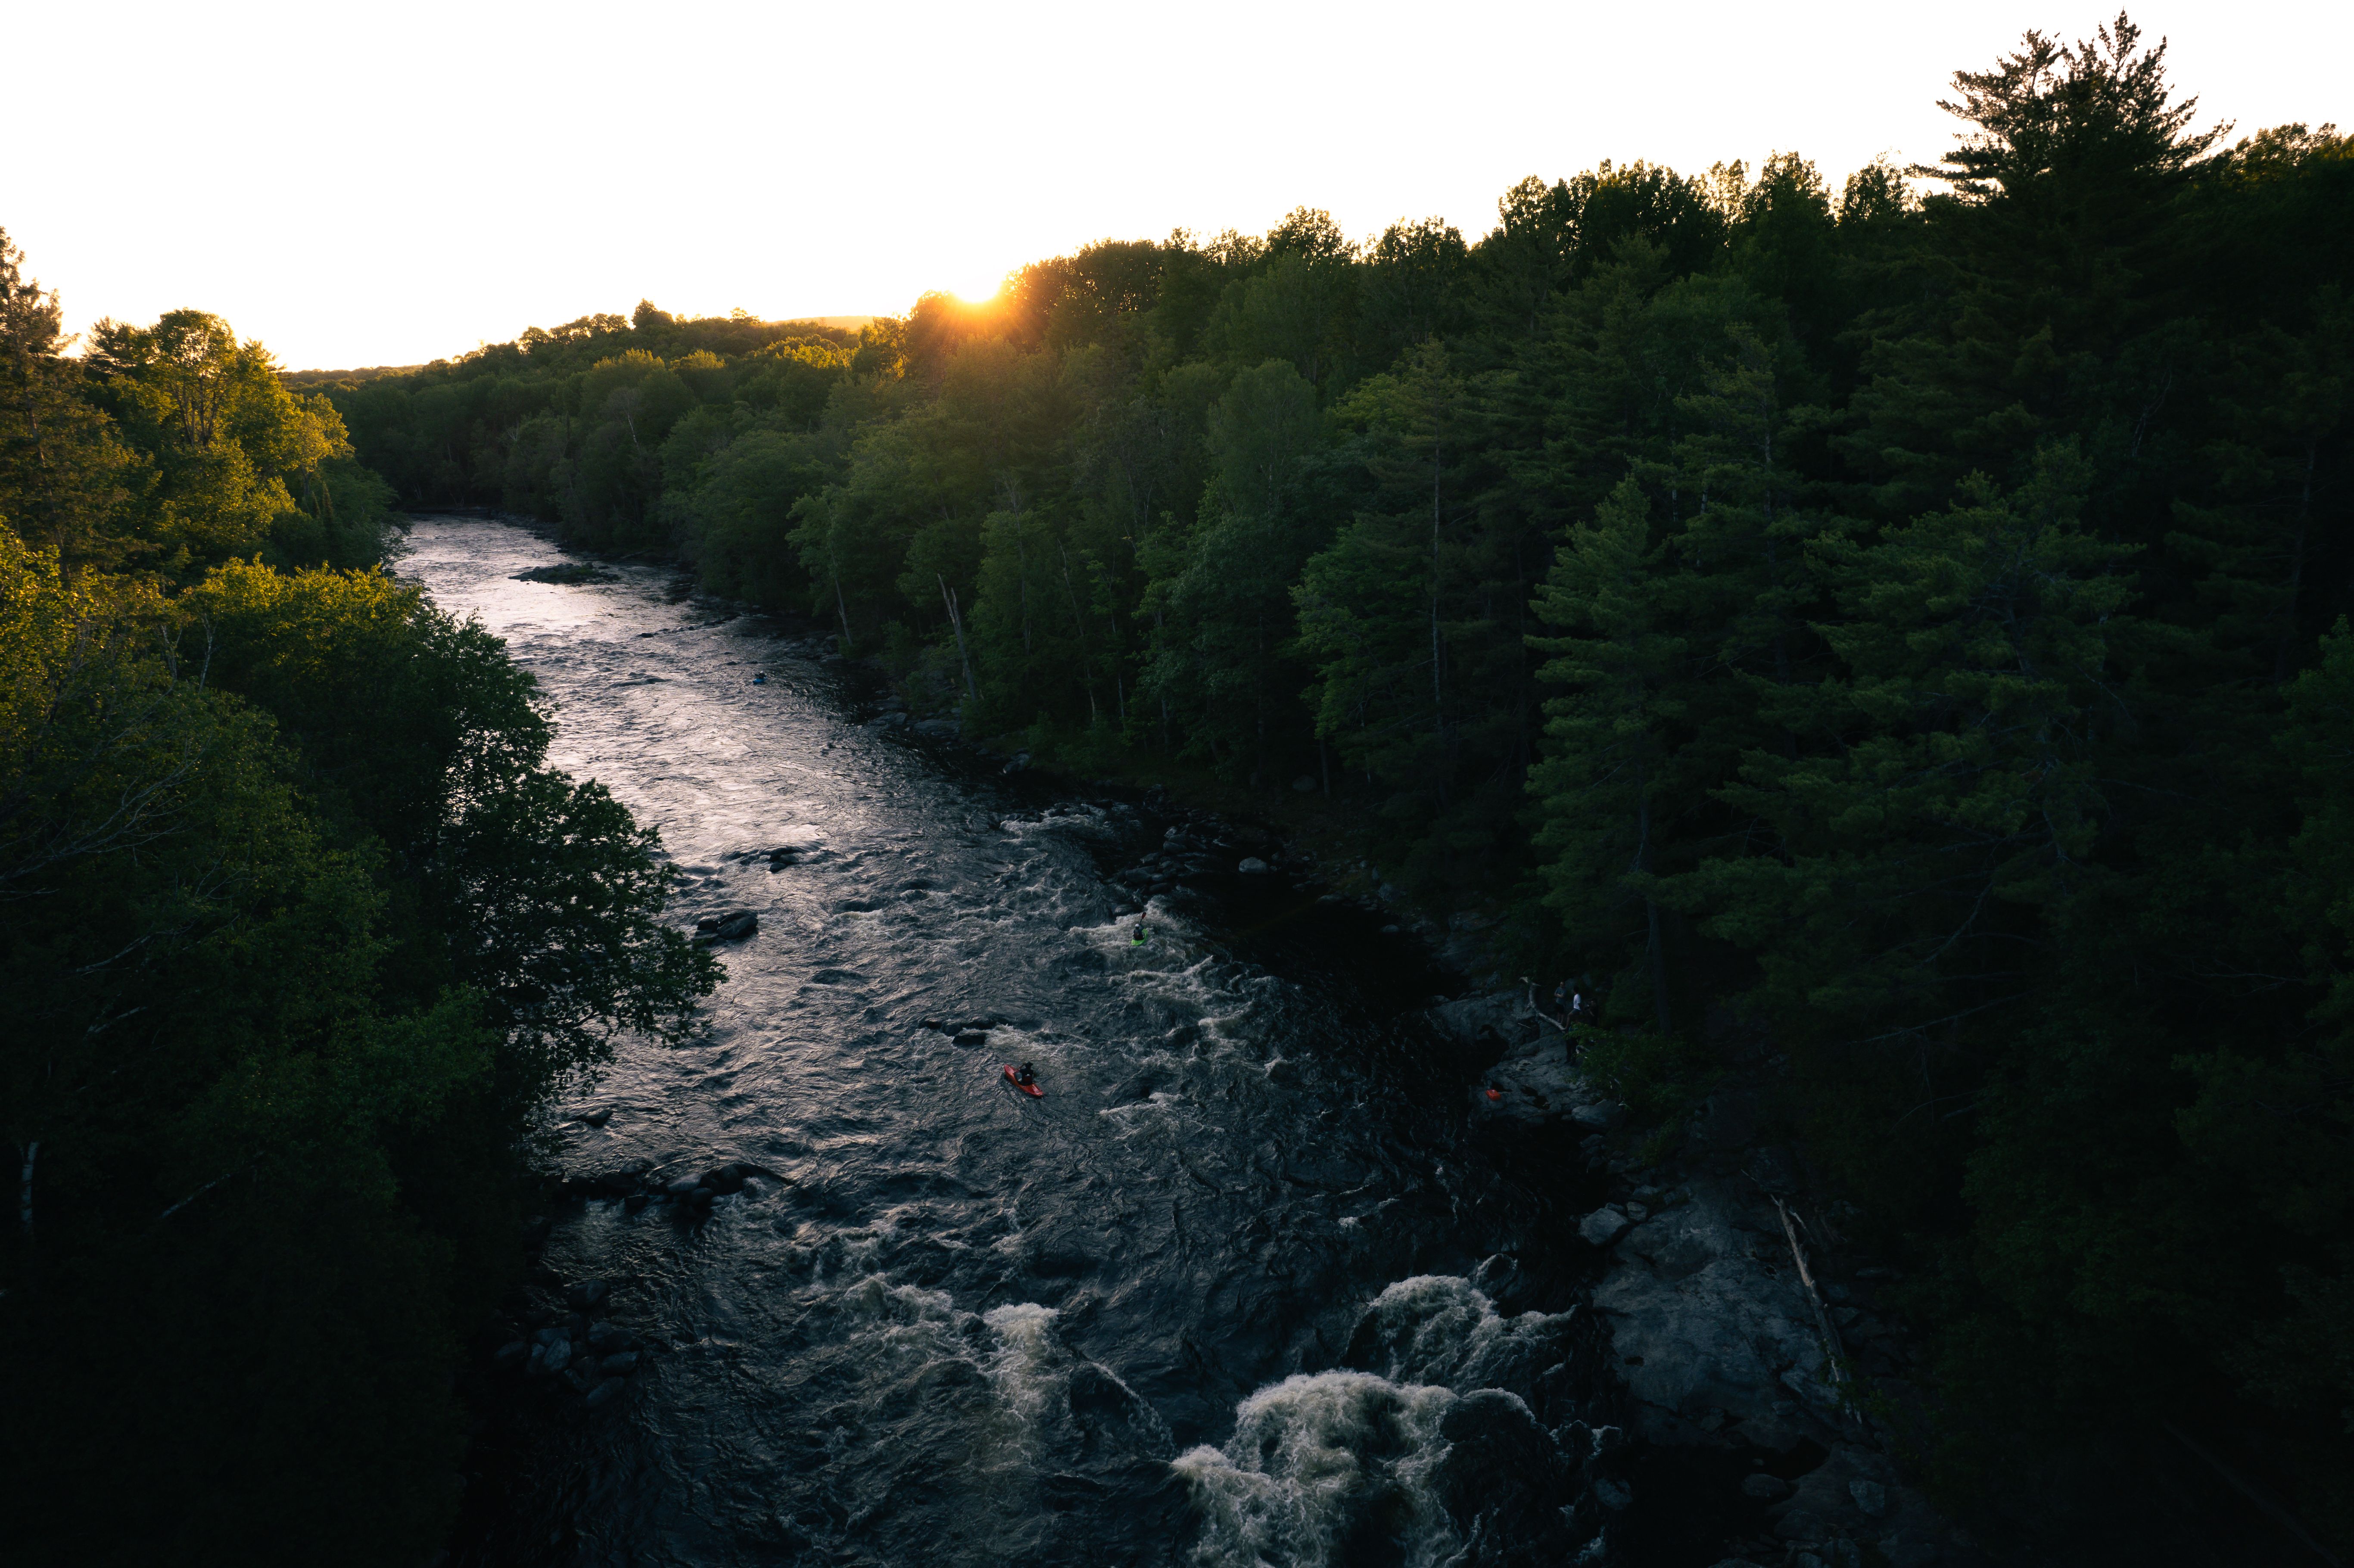
The watershed’s 146,000 square kilometres encompass everything from farms, mines, pulp mills and a nuclear facility to bustling cities and the loon-filled lakes of Algonquin Park. As a result, Ottawa Riverkeeper deals with road salt runoff, radioactive waste, microplastics and more. “The water quality issues are quite diverse and quite complex,” says Larissa Holman, the organization’s director of science and policy.
Then there are jurisdictional issues. The Ottawa River forms the boundary between Ontario and Quebec — provinces that capture data in different ways, set different monitoring thresholds and operate in different languages.
Larissa Holman is the Director of Science and Policy at Ottawa Riverkeeper
Harnessing the power of volunteers
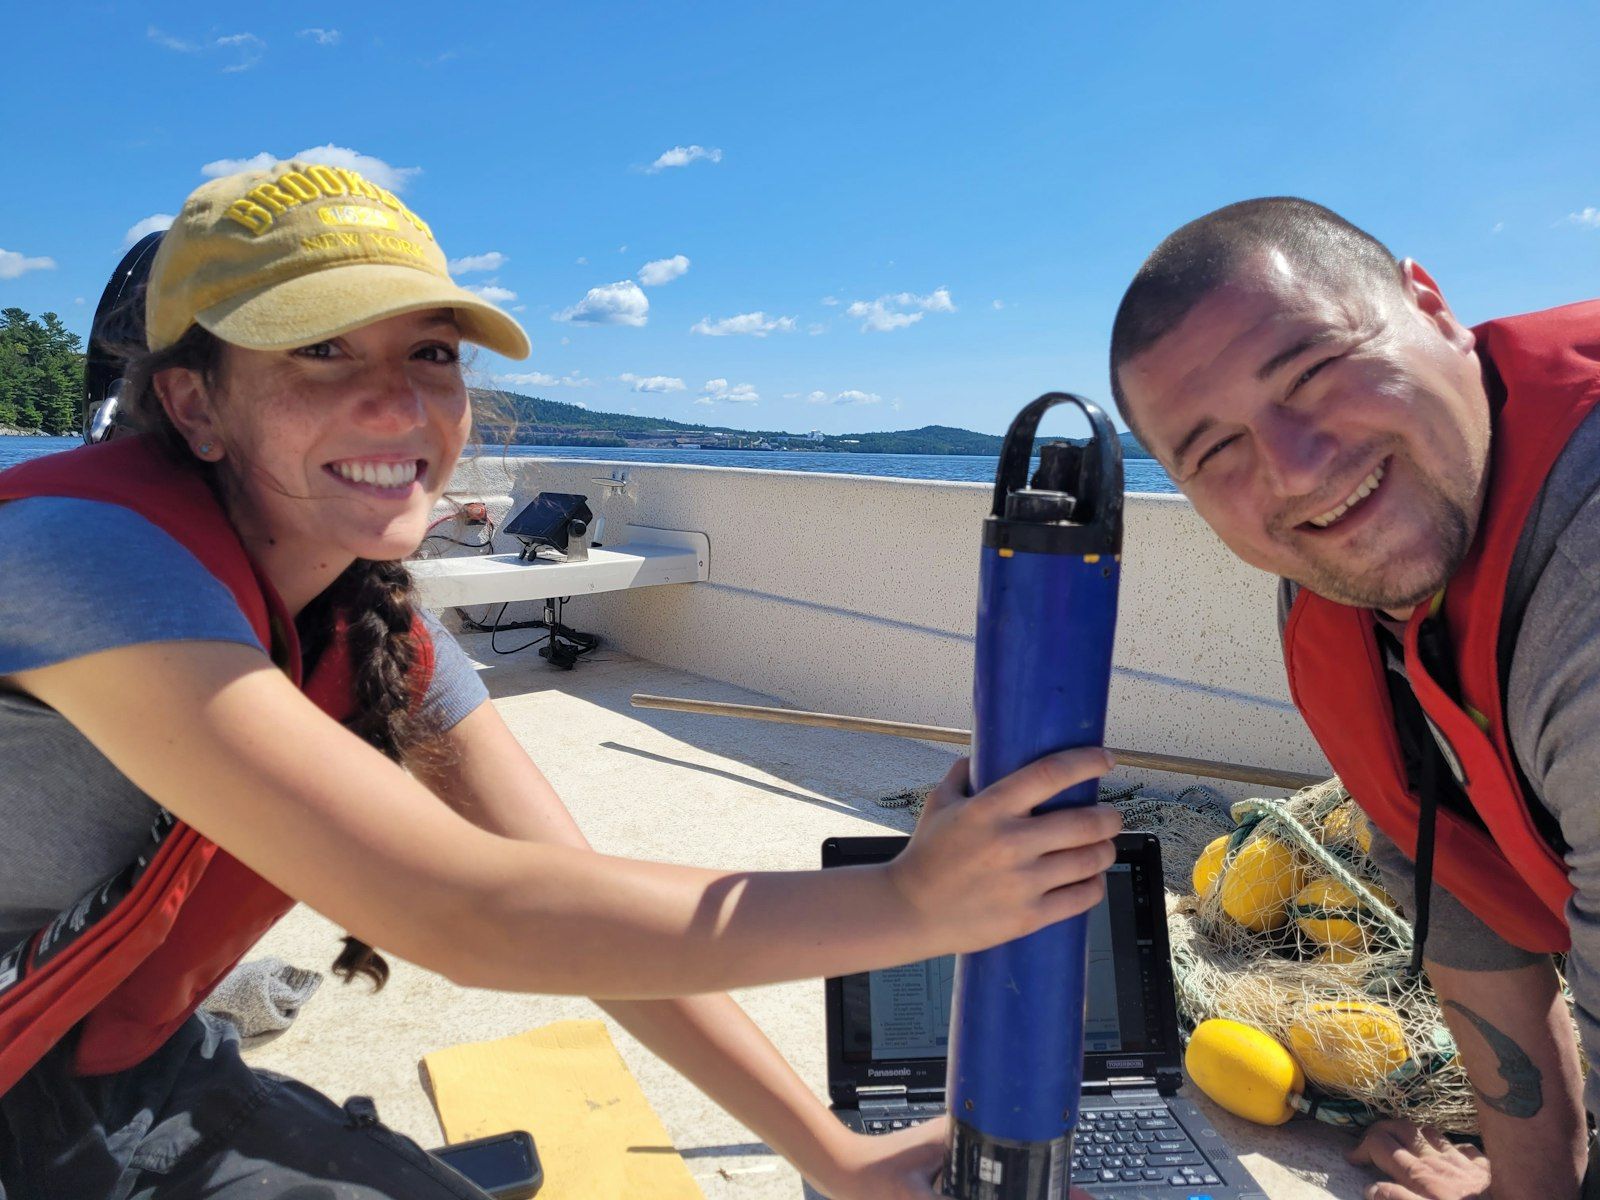
On the plus side, Ottawa Riverkeeper has no shortage of passionate volunteers stepping forward whenever they put out the call. “We are often overwhelmed by the response,” Holman says. “It becomes really clear that people really care about this water.”
Holman and her colleagues rely on those community scientists to collect data on pH, phosphorus, turbidity and other indicators throughout the region. Those efforts support programs like their Watershed Health Assessment and Monitoring Initiative.
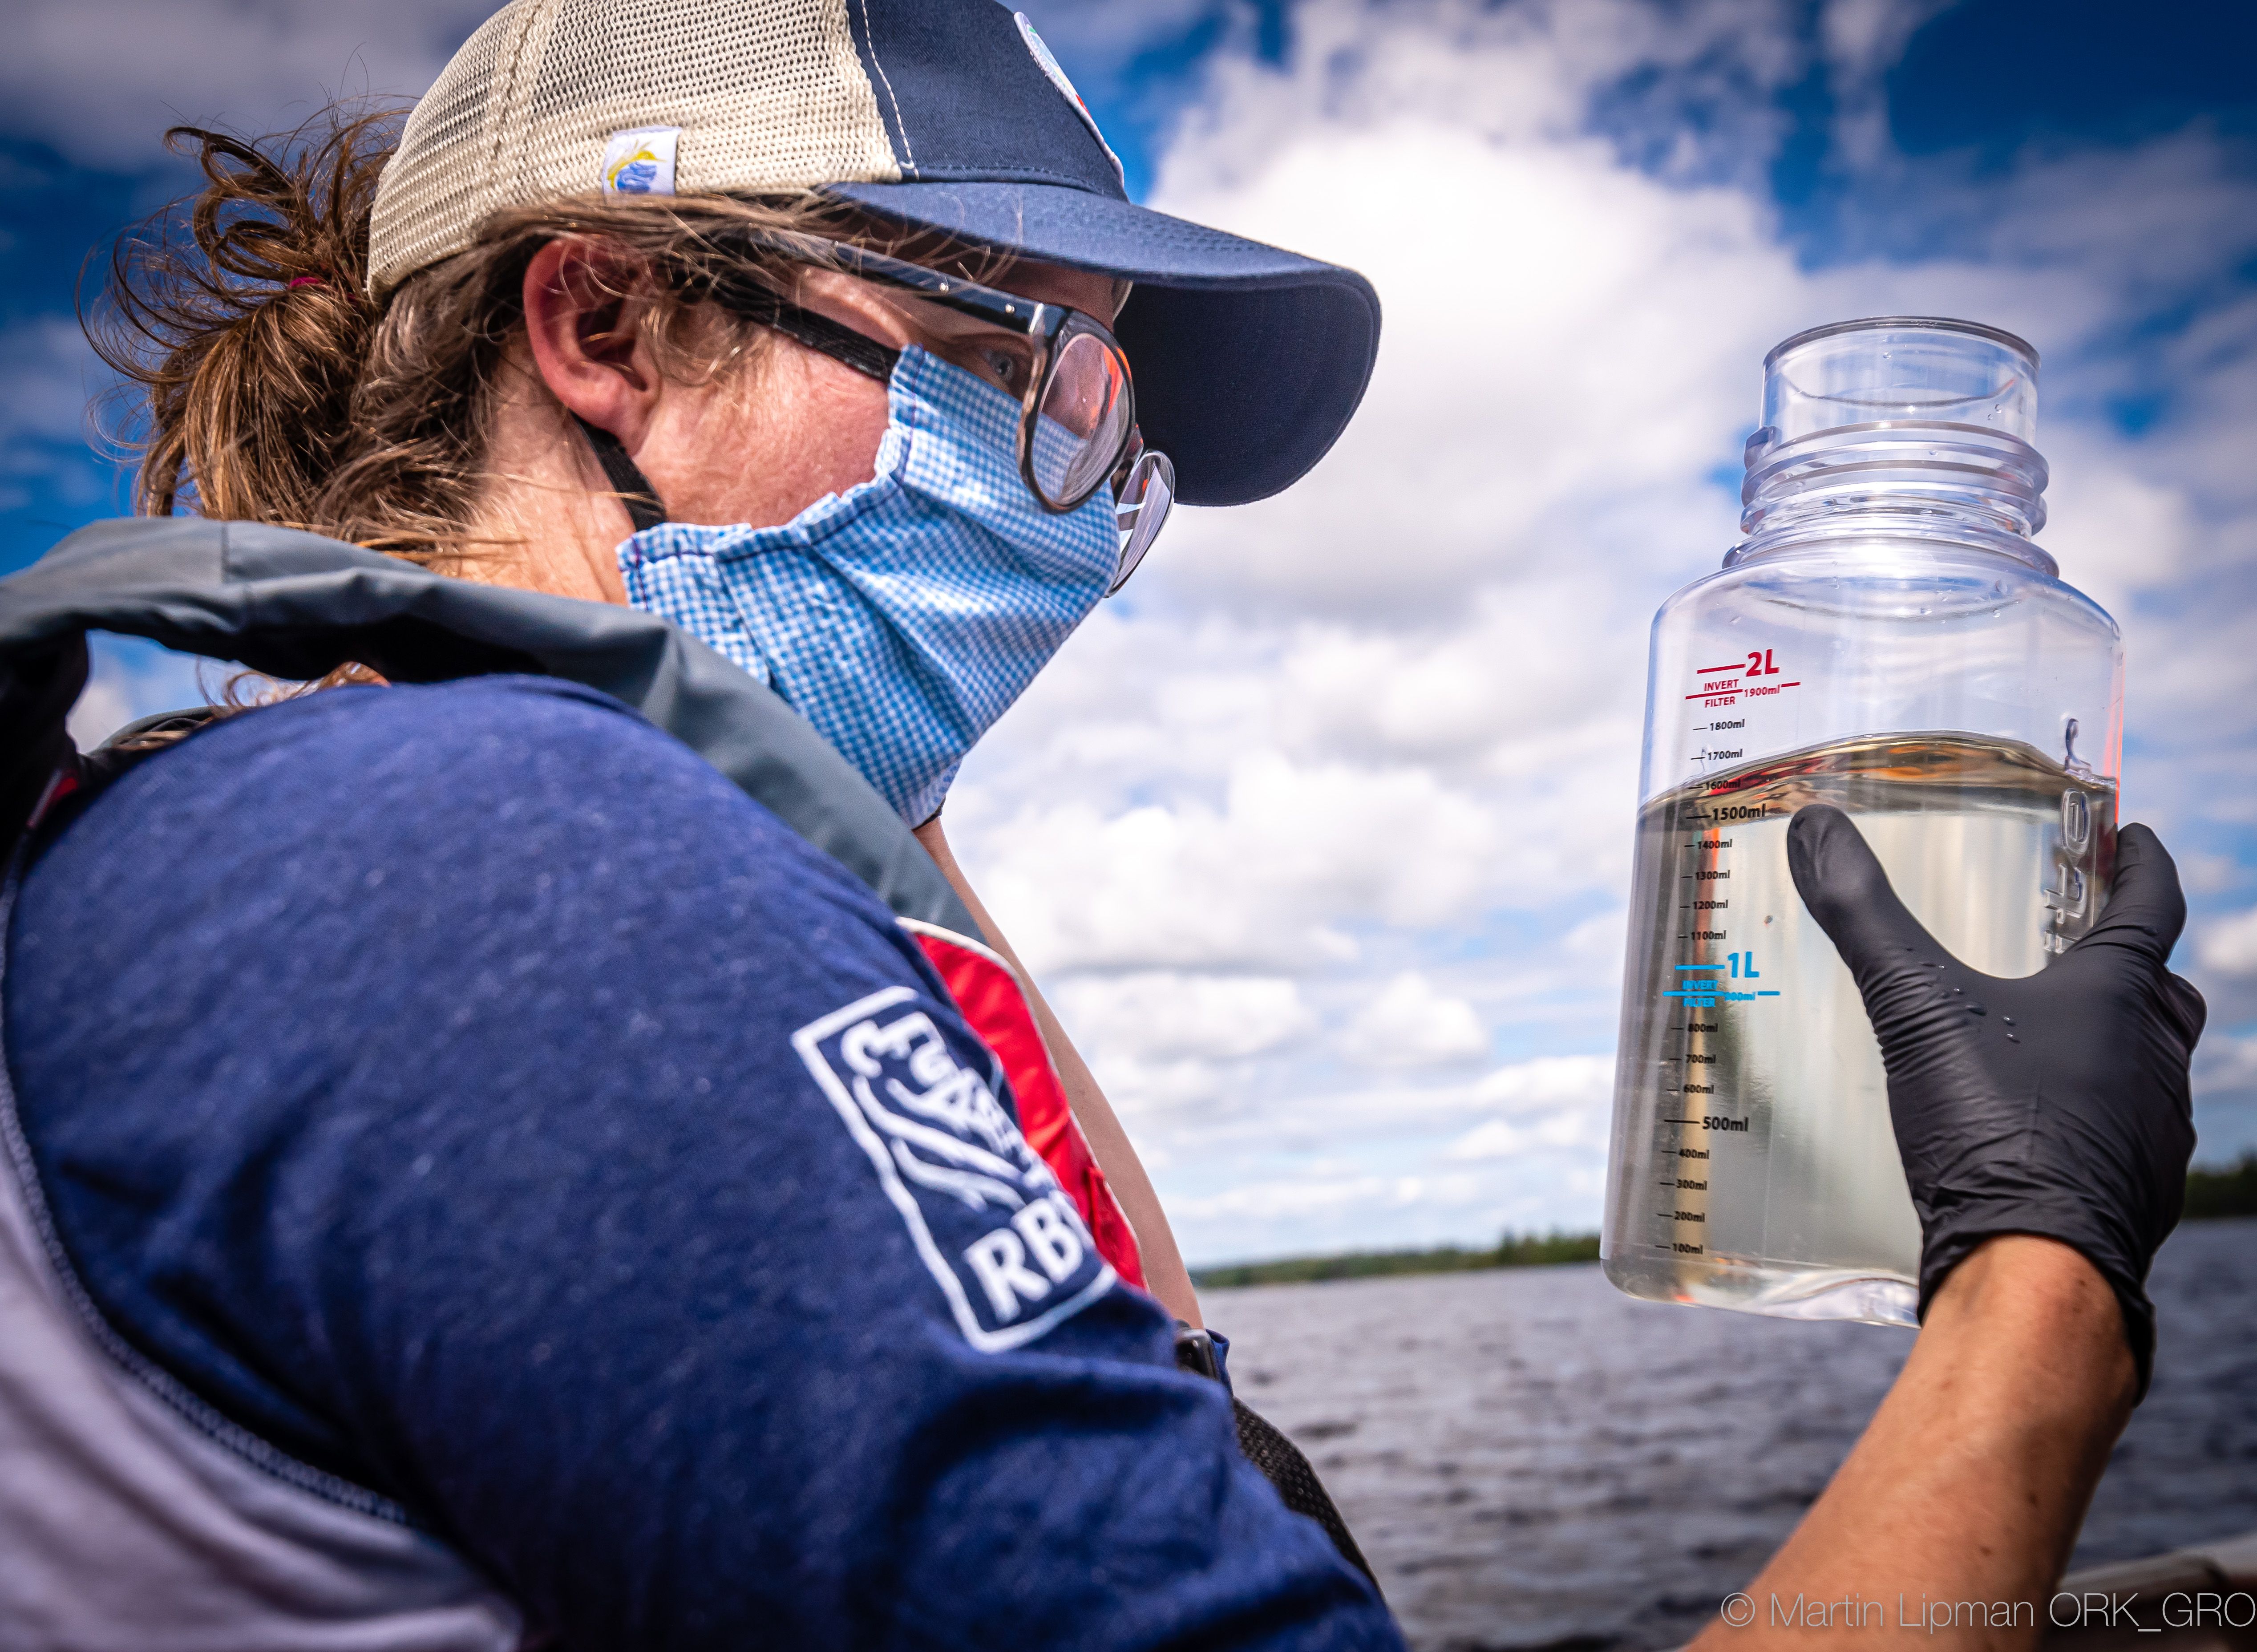
This multi-year project to monitor and protect swimmable, drinkable and fishable waters includes co-designing projects with two Algonquin communities — Kebaowek First Nation and Kitigan Zibi Anishinabeg — to address some of their key concerns.
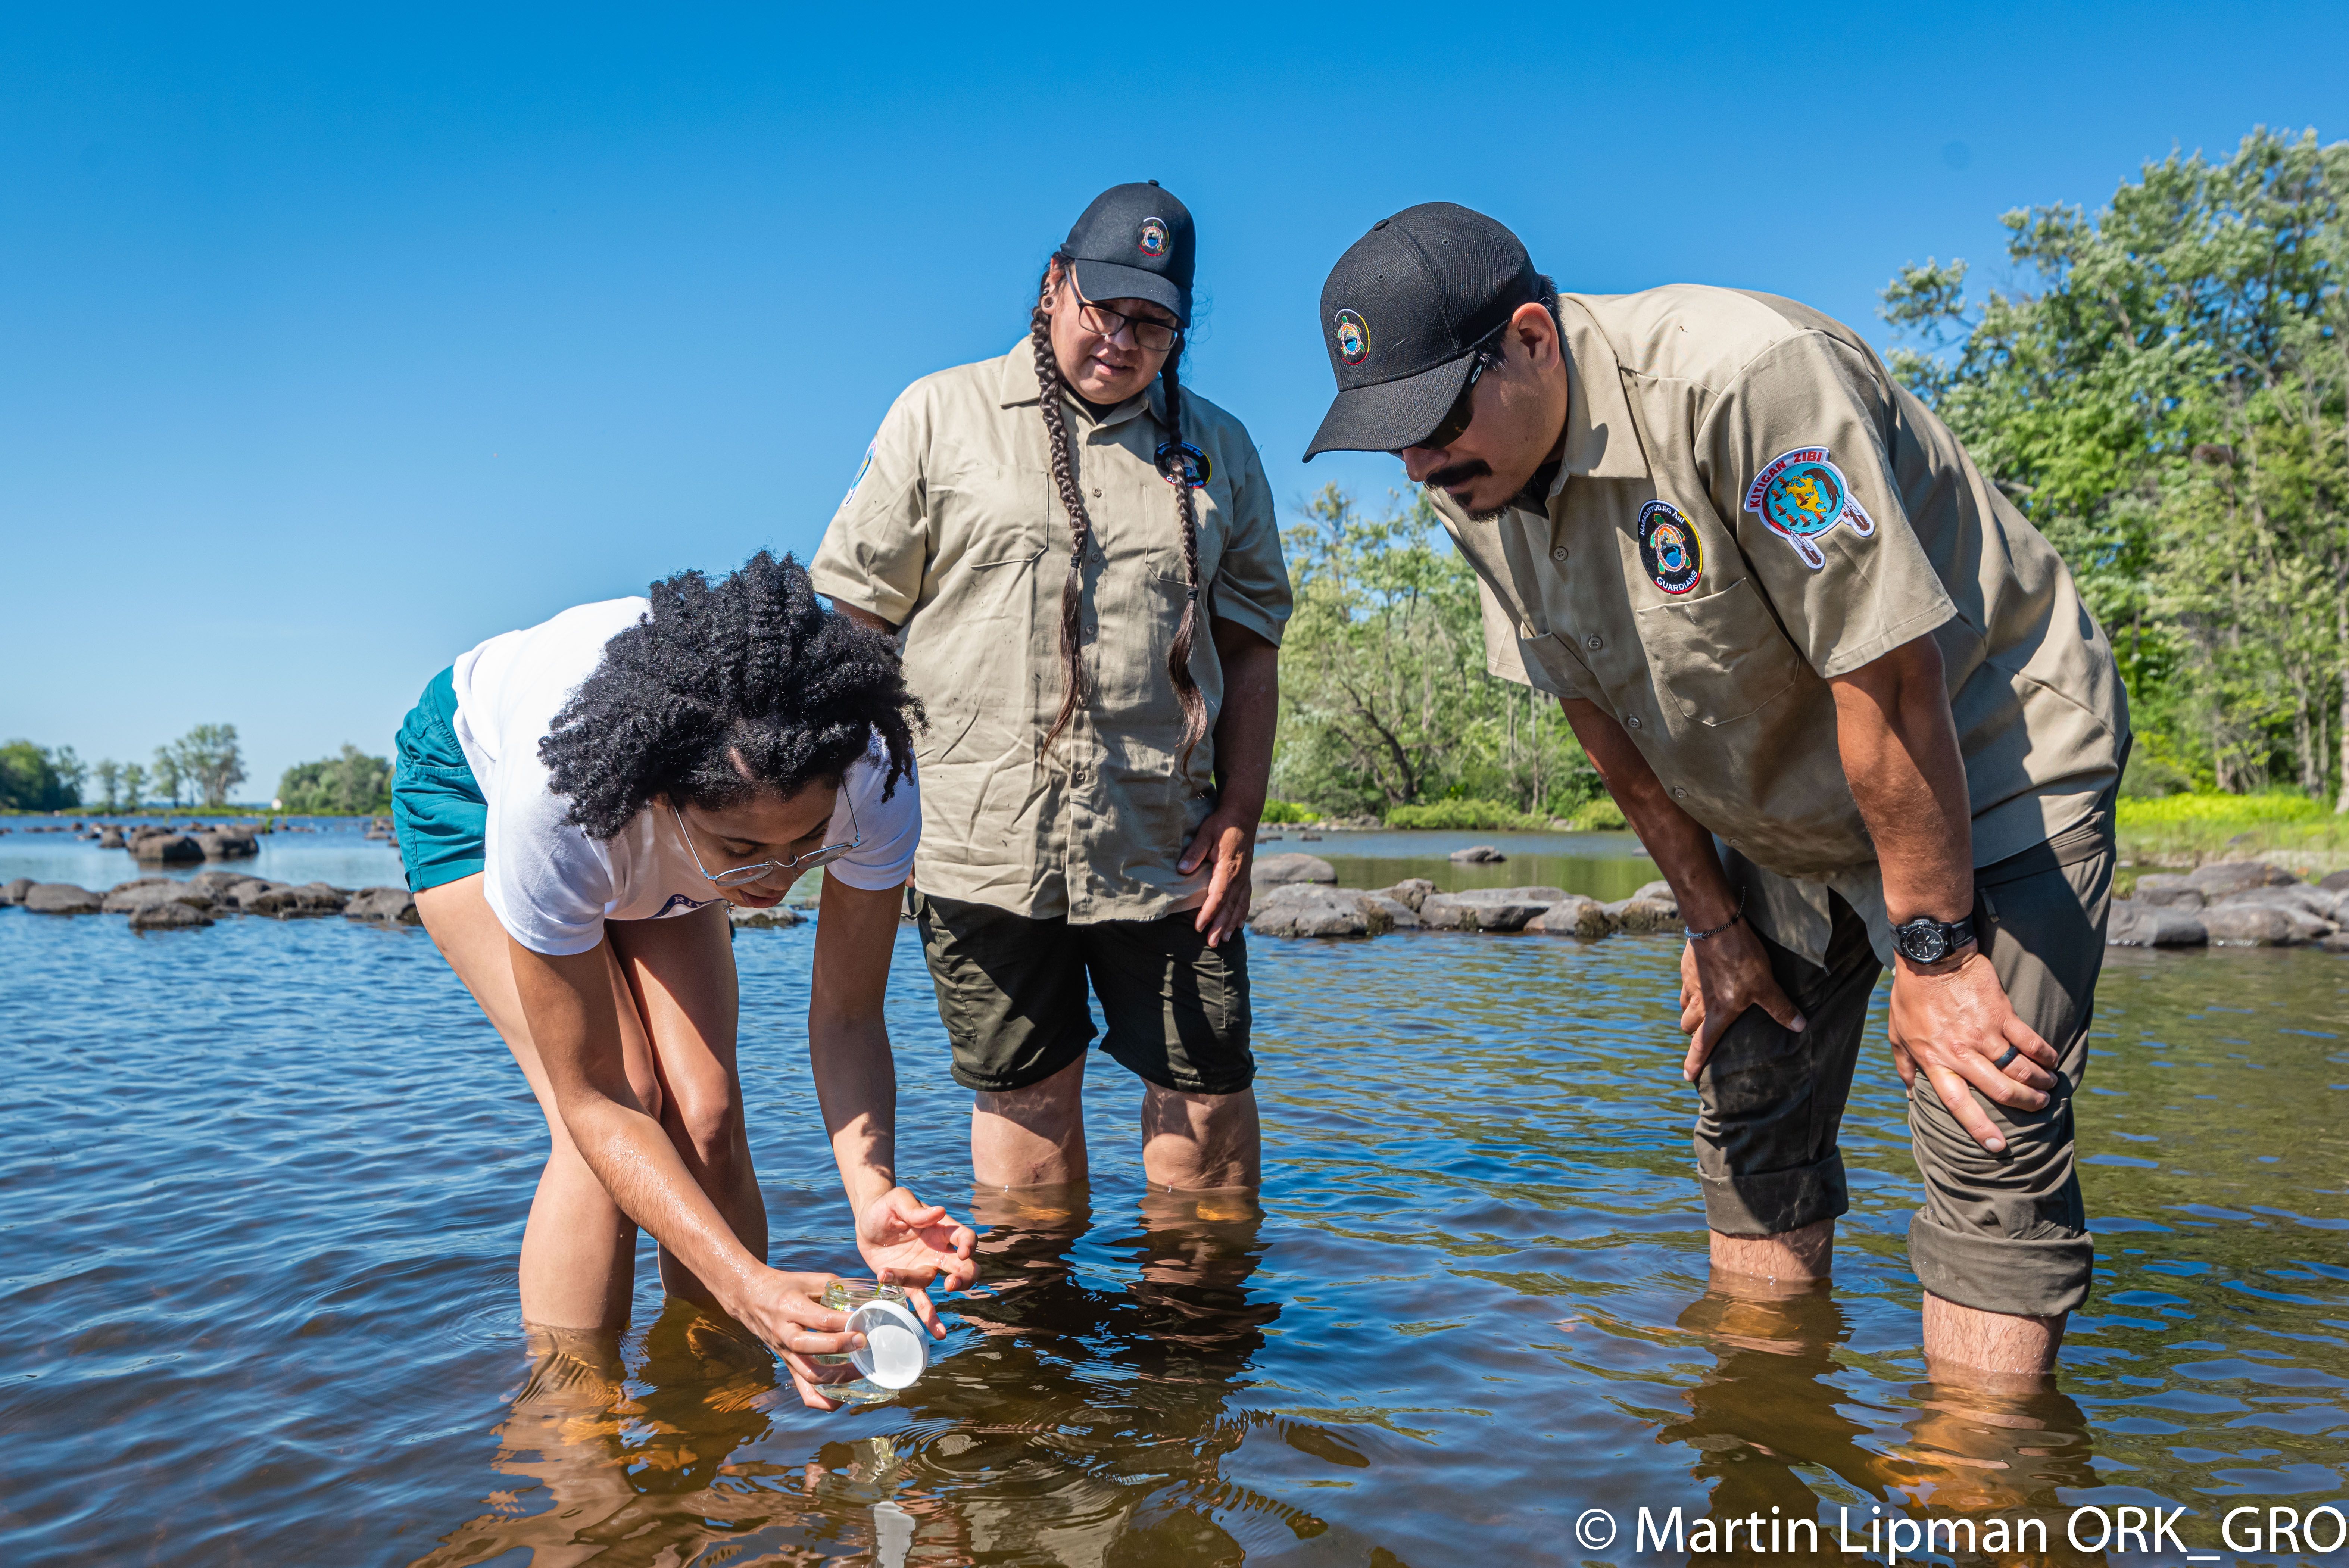
Ottawa Riverkeeper Biologist and Guardians from Kitigan Zibi Anishinabeg collecting algae samples
Tracking down missing information
Still, plenty of data gaps remain. To fill them, Holman and her team frequently turn to federal, provincial and municipal data. While much of that data is public, Ottawa Riverkeeper has been forced to file several access-to-information requests over the years — a process that can take months to complete.
“You’re never really sure when you’re going to get the data,” she says. “And you just hope that it’s in a format that is easy to use.”
That’s why she appreciates DataStream.
Data that packs a punch
DataStream’s online portal brings everything together in one place, ensuring each dataset contains all the pertinent information in a consistent format. “They’re good at getting data from these different authorities and making them accessible,” says Holman.
That accessibility is key when it comes to communicating with residents and decision makers. While Holman can pore over spreadsheets or GIS dots and understand what they mean, DataStream’s mapping and graphing tools brings that information to life for non-specialists — enabling them to explore multiple indicators at the same time, identify trends and see how their local waterway compares to others.
And that makes an incredible impact.
“Having the ability to dig in, and look, and try to understand water quality through data can be a very empowering experience,” says Holman. “The power of providing people with relevant information about their local waterway should never be undervalued. It can be an incredible way to motivate them to either protect or to improve it.”
View Dataset