Nutrient data guidance
Best practices for reporting nutrient data on DataStream
Introduction
This guidance is for data stewards uploading nutrient data to DataStream, to support a consistent approach to handling these data.
This consistency is particularly valuable in reducing ambiguity and facilitating data reuse given the diversity of ways nutrient data are reported by laboratories, monitoring programs and reporting agencies across Canada.
This guidance aligns with the U.S. Environmental Protection Agency and U.S. Geological Survey developed Water Quality eXchange (WQX) Nutrient Best Practices Guide (USEPA, 2017).
Data format
Data uploaded to DataStream need to be formatted in the DataStream data structure (DS-WQX).
Parameters (“characteristics”) are recorded using these 3 related fields:
Table 1: DataStream fields used to report a given nutrient characteristic.
| Field name | Description |
|---|---|
CharacteristicName | Identifies what is being measured (e.g., Temperature, Phosphorus) in a field or lab result. The name used must have a match in the Allowed Values list. |
MethodSpeciation | Identifies the chemical speciation, where applicable (e.g., Ammonium may be measured as N or NH4). |
ResultSampleFraction | Describes the portion of the characteristic being analyzed. |
Choosing the correct characteristic name
In practice, identical laboratory results are sometimes reported using different parameter/characteristic names. For example, a laboratory or reporting agency may use the characteristic name “phosphorus-phosphate” one year, and “phosphorus” the next year, even though they are collected and analyzed the same way both years. This also commonly occurs between different laboratories, as they have developed their own methodology and notation systems.
To promote consistency and avoid ambiguity, DataStream has aligned allowed values for characteristic names with the WQX recommended nutrient data names. Table 2 summarizes the preferred and allowed values for nutrient characteristic names, and their commonly reported synonyms. By following this table, nutrient data will be more easily comparable between datasets from multiple organizations around the country.
Table 2: Nutrient Result Guidance. This table displays preferred DataStream characteristic names for common nutrients, frequently reported synonyms, and possible methods of speciation and sample fractions for each characteristic.
| Preferred DataStream Characteristic Name | Commonly Reported Synonyms | Potential Method Speciation | Applicable Sample Fractions |
|---|---|---|---|
Ammonia |
|
|
|
Ammonium |
|
|
|
Ammonia and ammonium |
|
|
|
Inorganic nitrogen (ammonia, nitrate and nitrite) |
|
|
|
Inorganic nitrogen (nitrate and nitrite) |
|
|
|
Kjeldahl nitrogen |
|
|
|
Nitrate |
|
|
|
Nitrite |
|
|
|
Total nitrogen, mixed forms |
|
|
|
Organic Nitrogen |
|
|
|
Organic Phosphorus |
|
|
|
Orthophosphate |
|
|
|
Total phosphorus, mixed forms |
|
|
|
Soluble Reactive Phosphorus (SRP) |
|
|
|
NA – not applicable
Nitrogen Characteristics
Commonly reported forms of nitrogen-containing compounds include organically-bound nitrogen (bound to animal or plant tissues), ammonium (NH4), ammonia (NH3), nitrite (NO2) and nitrate (NO3). These compounds are often reported individually; however, specific groupings of these molecules are also common, due to the efficiency of laboratory analysis and/or for comparability between many laboratory assessments.
The characteristic “Total nitrogen, mixed forms” includes all forms of nitrogen (all compounds mentioned above), the characteristic “Kjeldahl nitrogen” includes organically-bound nitrogen and ammonia, and the characteristic “inorganic nitrogen” includes ammonia, nitrite and nitrate (Figure 1). Note that inorganic nitrogen is commonly reported two ways, one including ammonia, the other not.
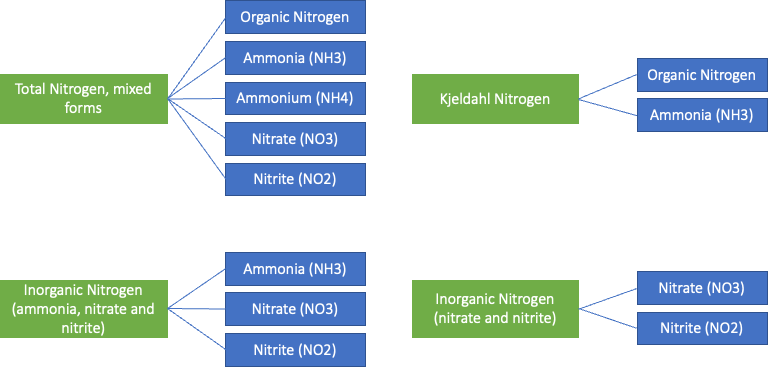
Figure 1: Nitrogen atoms exist in various molecules and forms in water (NH4, NH3, NO3, NO2, organically bound). Each of these molecules, along with specific groupings of molecules are commonly tested and reported characteristics. Green boxes indicate commonly reported characteristics that are groupings of multiple nitrogen characteristics, and blue boxes indicate commonly reported individual nitrogen characteristics.
Phosphorus Characteristics
Commonly reported forms of phosphorus-containing compounds include orthophosphate (PO4), the specific fraction of orthophosphate which cannot be removed via filtration (often referred to as soluble reactive phosphorus [SRP]), organic phosphorus and total phosphorus (Figure 2). The characteristic “total phosphorus, mixed forms” includes all forms of phosphorus including organic phosphorus, orthophosphate (soluble and insoluble) and acid hydrolysable phosphorus. Note that acid hydrolysable phosphorus is not commonly reported on its own. Phosphorus concentrations in water are very often determined using colorimetry, a scientific technique which measures concentrations of colored compounds based on light absorbance. The specific phosphorus characteristic being measured depends on the prescribed pre-treatment of the sample (persulfate digestion, H2SO4 hydrolysis, or no-treatment) prior to colorimetry analysis, as displayed in the figure below.
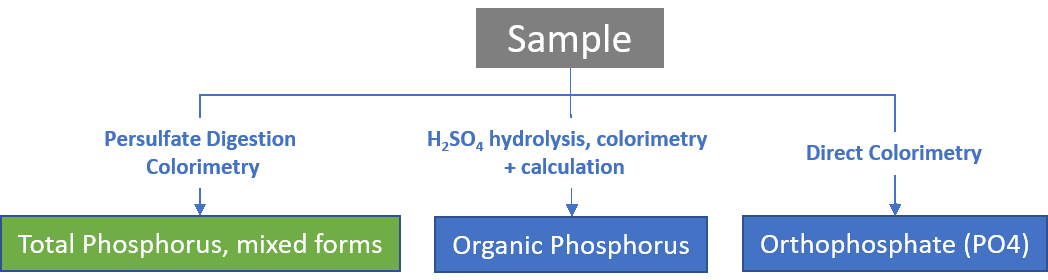
Figure 2: Phosphorus characteristics as determined using colorimetry and prescribed pre-treatments of the water sample (persulfate digestion, H2SO4 hydrolysis, or no-treatment) prior to colorimetry analysis. Blue boxes indicate commonly reported individual phosphorus characteristics (Organic Phosphorus and Orthophosphate (PO4)), and green boxes indicate commonly reported characteristics that are groupings of multiple phosphorus characteristics (Total Phosphorus, mixed forms). Total phosphorus, mixed forms includes organic phosphorus, orthophosphate and hydrolysable phosphorus.
Choosing the correct method speciation
Method speciation refers to the chemical species reported in a sample. This distinction is necessary as different species measured in the same sample will have varying mass values.
The example below (USEPA, 2017) illustrates method speciation and its importance:
Nitrate results can be reported “as Nitrate” (the molecular form, NO3 = 1 Nitrogen atom + 3 Oxygen atoms) or “as Nitrogen” (the elemental form, N = 1 Nitrogen atom). The Nitrogen atom accounts for 22.5% of the weight of a Nitrate molecule. The oxygen atoms account for the rest. So, the same amount of Nitrate in a single sample can be reported two ways--“Nitrate as N” or “Nitrate as NO3”. The “Nitrate as N” value will be 22.5% of the “Nitrate as NO3.” value. For example, 1 mg/L of Nitrate as N is the same as 4.5 mg/L Nitrate as NO3 for the same amount of Nitrate in a single sample.
The following equation demonstrates the concept in a conversion factor:
45mg/L Nitrate as NO3 X 0.225 = 10 mg/L Nitrate as N
Note that it is not necessary to input nutrient results under two different methods of speciation. A simple conversion factor allows data users to convert data to the desired speciation. Table 3 illustrates conversion factors for multiple characteristics.
Table 3: Conversion factors for several commonly reported characteristics.
| Characteristic | Reported Speciation | Multiplied by | To obtain |
|---|---|---|---|
Ammonia | as NH3 | 0.822 | as N |
Ammonium | as NH4 | 0.776 | as N |
Nitrite | as NO2 | 0.304 | as N |
Nitrate | as NO3 | 0.225 | as N |
Orthophosphate | as PO4 | 0.326 | as P |
In many labs, nutrient data are not reported with method speciation because it appears redundant to report “Nitrate as NO3” or “Nitrate as Nitrate”, so they will simply use “Nitrate” instead. Within the lab, this notation is understood, but it is not immediately clear to those obtaining results if “Nitrate” refers to “Nitrate as NO3” or “Nitrate as N”. For this reason, we recommend that a discussion takes place with the lab to either have results displayed in the desired notation or have the lab’s notation explained.
Choosing the correct sample fraction
A sample’s fraction is determined by its level of filtration, which is a physical process used to separate particulate and aqueous fractions of a water sample. Unfiltered sample fractions include the amount of the chemical in both the particulate and aqueous portions, and filtered sample fractions will only include the chemical in the aqueous portion. Non-filterable sample fractions only include the material that cannot pass through the filter, i.e., the particulate portion.
Knowledge of each sample’s filtration status is crucial as values may differ greatly between filtered and unfiltered samples. There are other sample fractions that apply to other characteristics that are obtained by methods other than filtrations, such as digestion, but filtration is the main determinant of sample fraction for nutrient characteristics.
DataStream requires data stewards to input nutrient data with one of five fraction types (Table 4). This is done for two main reasons. Firstly, the term “total” is used frequently in laboratory notation, which has an ambiguous meaning given that it can refer to both the combination of organic and inorganic (or mixed) nutrient forms, as well as the combination of aqueous and particulate nutrients. To reduce confusion, DataStream follows WQX best practices by differentiating the physical groupings as filtered (i.e., dissolved), unfiltered (i.e., total), and nonfilterable (i.e., particulate), and reserving the term “total” to refer to groupings of nutrient characteristics (i.e., “mixed forms”).
Secondly, the filtration status gives data users information about the quality of the data and/or comparability with other data. Apart from the differing values between filtered and unfiltered portions, knowing the location of filtration (e.g., field or lab) is important, as some nutrient parameters can be affected by microbial activity, which metabolizes nutrients into other forms. This can be an issue if the samples spend too much time in a collection container before laboratory analysis, resulting in potentially inaccurate readings. If a sample has been filtered, but the location of filtration cannot be determined from field notes or laboratory methods, then the recommended sample fraction is “filtered”.
Table 4: Sample fraction types available in the DataStream upload template.
| Sample Fraction | Description |
|---|---|
Filtered, lab | Aqueous portion of sample, filtered in lab |
Filtered, field | Aqueous portion of sample, filtered in field |
Unfiltered | Aqueous and particulate fraction |
Non-Filterable (Particle) | Particulate, did not pass through filter |
Filtered | Location of filtration is unknown |
Filtered samples are either designated as being filtered in the field or in the lab. Since the same laboratory methods can be used on either field or lab filtered samples, the method description provided by the lab may not be adequate to determine where the sample was filtered. Again, it is important to ensure the lab, or staff collecting samples record the filtration status.
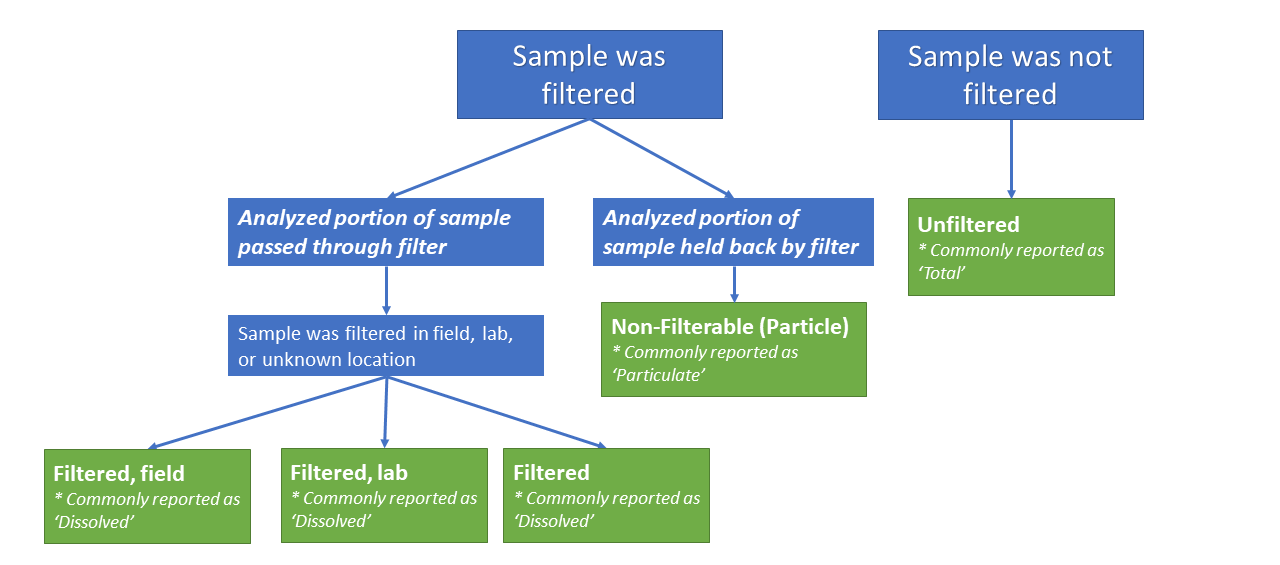
Figure 3: For nutrient data, a sample’s fraction is determined by its level of filtration. Unfiltered sample fractions include the amount of the chemical in both the particulate and aqueous portions, and filtered sample fractions will only include the chemical in the aqueous portion. Non-filterable sample fractions only include the material that cannot pass through the filter, i.e. the particulate portion.
Detection Limits
Lower detection limits are the lowest quantity of a substance that can be distinguished from the absence of that substance (in the case of upper detection limits; the highest quantity of a substance that can be reliably measured). When a result is below a detection limit, its exact amount cannot be determined, but it is still important to report this result as it conveys that the substance is at a low concentration, or not present at all. If left out from a dataset, only values over the detection limit will be displayed, skewing any statistical analyses of that substance.
When a result is below or above a detection limit, the result value is left blank. The result detection condition (Table 5) and quantitation limit measure, unit and type must be inputted to adequately describe the result.
Table 5: Detection conditions available in the DataStream upload template.
| Result Detection Condition | Description |
|---|---|
Above Detection/Quantification Limit | For lab data where results exceed defined laboratory detection/quantification/reporting limits, e.g., colony count and rare occasions where the result is above highest calibration curve point concentration |
Below Detection/Quantification Limit | For lab data where results are less than defined laboratory detection/quantification/reporting limits |
Detected Not Quantified | For lab or field data where the parameter is detected but cannot be quantified, e.g., microbiological tests that return a presence/absence result |
Not Detected | For lab or field data where the parameter is not detected and where detection/quantification/reporting limits are not specified or applicable, for example microbiological tests that return a presence/absence result |
Not Reported | For instances where a lab is not able to report a result of any type (for example, where the sample was lost/destroyed or where quality assurance requirements are not met) |
This guidance was prepared in collaboration with Logan Boyer of Management and Solutions in Environmental Science (MSES Inc.) and Dr. Megan Thompson of Thompson Aquatic Consulting.
References

If you have any questions or need help formatting your data, our Data Specialists are happy to assist you with this process.